Vancouver Zoning Map
All the neighbourhoods that are too good for apartments
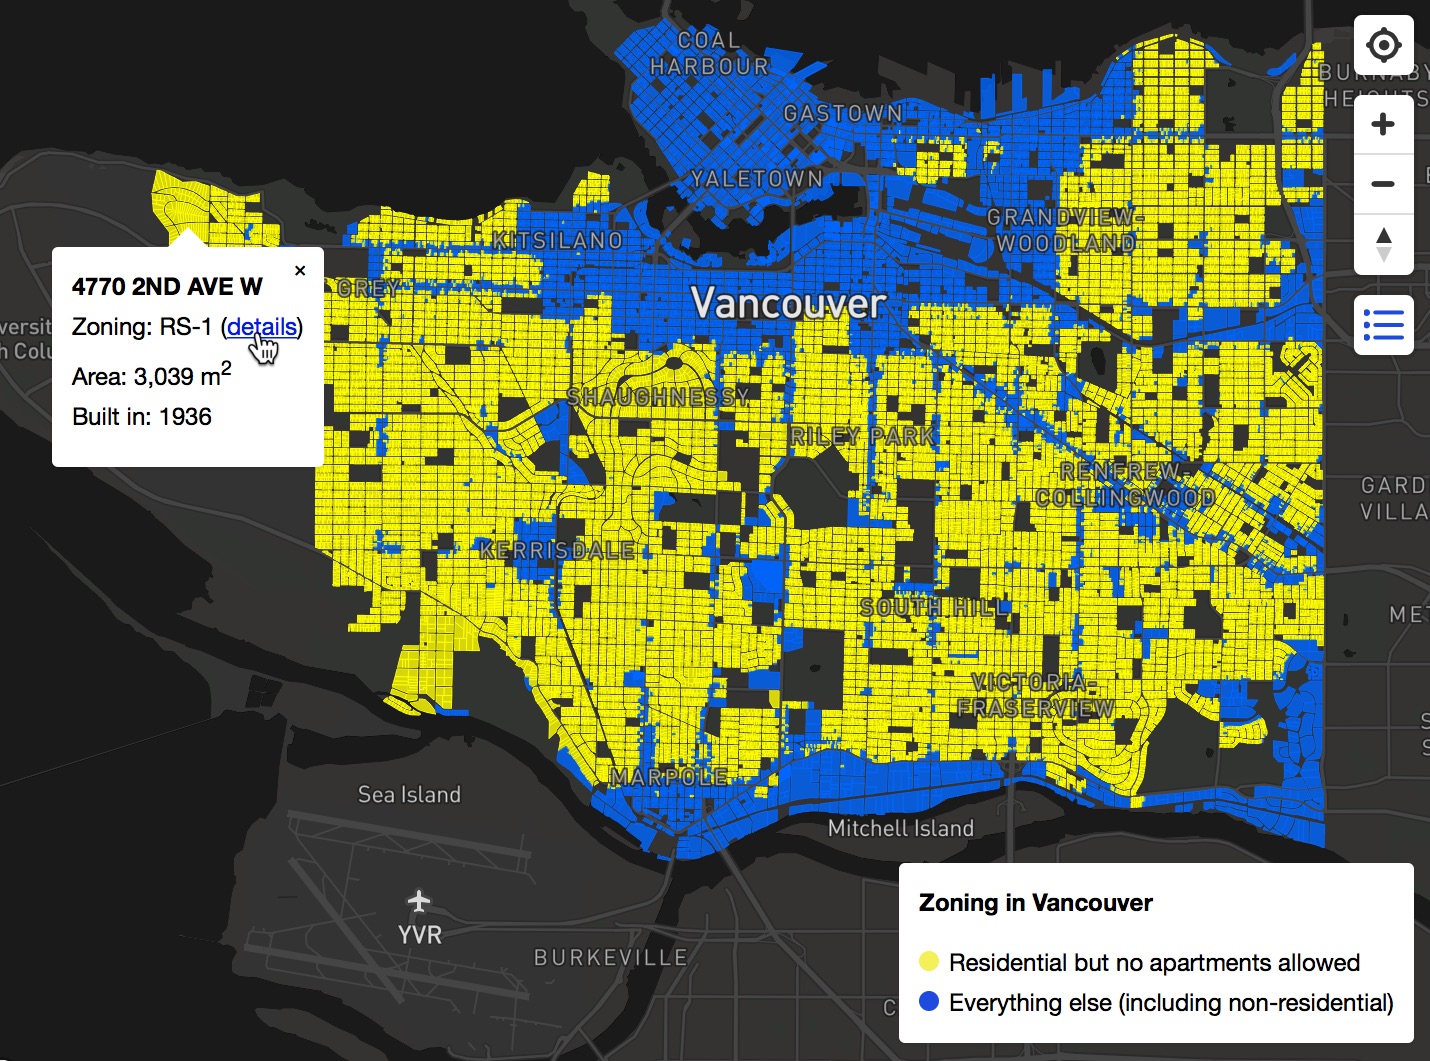
This is an interactive map that shows how the majority of Vancouver’s land is zoned for residential use, but forbids apartment buildings. It’s the third version of this static map I put together in 2015.
Details, Assumptions and Disclaimers
The following are in the “residential but no apartment buildings allowed” classification:
- RS One-Family zones
- To be fair, the “One-Family” name is a bit out of date. These zones allow up to 3 units on a lot: main suite, secondary suite, and a tiny laneway house. Anything beyond that (like, say, a small apartment building) is verboten.
- RT Two-Family zones
- These have a complicated history but these days they’re not that different from RS zones. The remarkably numerous and arbitrary differences among RS and RT zones have been valiantly summarized here.
- First Shaughnessy District
- Vancouver’s first mansion district. In 1914, the province passed the Shaughnessy Settlement Act of 1914, permitting only single-family houses in the area. Today, the city effectively does the same thing (and also enforces very large minimum lot sizes to keep the area especially exclusive).
- RA-1 Limited Agriculture zone
- This is how many of the mansions in Southlands are zoned. It’s theoretically agricultural land (in the ALR), but it also allows houses so we ended up with a bunch of massive mansions for dressage enthusiasts. Those mansions are not permitted to be split into a bunch of smaller apartments.
- A handful of Comprehensive Development zones
- “Comprehensive Development” is Vancouver’s term for spot zoning – a zoning district tailor-written for a single lot. There are 600 (and counting) CD zones, and some of them are effectively single-family zoning. I’ve classified as yellow the ones I’m familiar with but I’m sure I’m missing a few.
I’ve also excluded the following land uses from the map:
- R100 Recreation, Open Space and Protected Natural Areas
- R200 Lakes, Large Rivers and Other Water
- S400 Institutional
- S420 Cemetery
- S500 Road Right-of-Way
- S700 Rail, Rapid Transit, Other Transportation, Utility and Communication
Without this, the visualization can be a bit misleading because RS-1 (“One-Family”) zoning is sort of the default zoning in Vancouver (which is telling…) – there are a number of parks/schools/etc. that happen to be zoned RS-1, but in practice that land will never be used as single-family houses. This is more of a judgment call than I’d like, suggestions for improvement are welcome.
Note that a few parcels around the edges of blue/yellow regions are coloured incorrectly at lower zoom levels. This is a known bug in the software I use to simplify the map at lower zoom levels, just zoom in if you’re unsure.
So What Does This Mean?
No matter how you slice it, the majority of Vancouver’s residential land is reserved for very low-density suburban forms of development (UBC sociologist Nathanael Lauster has called this “The Great House Reserve”). This is not a sustainable way to use scarce land in Western Canada’s biggest city, and it forces many people to commute long distances to important amenities and institutions (UBC, B.C. Children’s Hospital…).
This doesn’t mean we need to allow towers everywhere (although I’d personally be OK with that!) – we could let a lot more people live here just by allowing low-rise apartments like we used to.
Technical Deets
It’s an Angular web app using Mapbox GL JS, and the source code is available on GitHub.
The mapping data is pulled from a PostGIS database then processed using Tippecanoe to significantly reduce the data size at lower zoom levels. Tippecanoe saves to an mbtiles file (it’s a neat format!), and mbtiles files are very easy to serve. I’m running my own mbtiles server (which is surprisingly easy) to get around Mapbox’s 500k/tile limit.
Acknowledgments
The map is significantly inspired by Jens von Bergmann’s much nicer and more featureful Vancouver assessment map, and I’m also in debt to Jens for sharing his cleaned-up open data. He did much of the unpleasant work of joining up multiple not-quite-perfect data sets.
The underlying data is originally from Vancouver Open Data (they have zoning data) and Metro Vancouver Open Data (they have and use data which is very useful for excluding parks etc.), and kudos to them for sharing it.


